If you are familiar with the web vitals Google recommends to test the loading speed of a website, you may know how challenging optimizing a website to a perfect score can be. Multiple are the factors affecting the performance results, from the server TTFB (Time To First Byte) to the CLS (Cumulative Layout Shift). When you work on the score of an entire website, every factor must be taken into account and getting a perfect score can become a very challenging task, especially because some elements could fall beyond your direct control.

The PageSpeed Insights Mobile score on web.dev for the homepage of this website.
For our tests, though, some of these factors are completely irrelevant because we are not looking for a global measure of the entire website. We rather want to investigate the impact of our script on the page loading time and minimize its effct on the overall page performance, whatever its initial value might be. From a purely theoretical point of view, we could have tested the result in any environment – regardless of its absolute optimization – by simply measuring the performance of any given page with and without our player. The reason we decided to start from a perfect score is just to show you how transparent our script is in terms of performance.

The PageSpeed Insights Desktop score on web.dev testing the homepage of this website.
We are now going to review all the assumptions we made to perform our tests. Before going ahead, we want to emphasize that the scores illustrated in the pictures above would not be possible if WavePlayer was not developed with all those recommendations in mind.
The closer, the faster
Our main goal is to exclude any possible delay that is not attributable, directly or indirectly, to the script of our player. Only if we work in the best conditions we can be sure that the conclusions we make about our script have any validity. So we made sure to use the closest GTMetrix test server to the datacenter where our website is located. Since our website is hosted by Siteground and the server is located at the Google Cloud datacenter in Council Bluffs, Iowa, we picked the GTMetrix test server in Chicago, Illinois. This choice guarantees the shortest TTFB for every browser request, minimizing any possible delay that is extraneous to our script.

A DNS latency test showed very different results across the United States with the shortest latency in Chicago, IL (12 ms), the closest DNS server to our datacenter, and the worst in Mountain View, CA (75ms)
Yes, we are choosing the most favorable conditions but simply because we need to exclude any possible delay that doesn't originate from our plugin itself. For example, if we tested our web page from a server in Johannesburg, South Africa, the result would be penalized by a much higher DNS latency (280 ms compared to the 12 ms we got from Chicago), which would worsen the PageSpeed results considerably even before there could be any possible interaction with our page and, ultimately, with our script.

The DNS latency becomes progressively longer when considering the DNS servers globally, with the worst result in India (257 ms) and South Africa (280ms)
Another useful tool for your DNS timing investigations is Byte Check. Byte Check offers a detailed report of your website response time, from the DNS lookup to the moment the browser starts receiving the first byte of the current request (TTFB). According to Web.dev a TTFB audit fails when it takes longer than 600 ms. Anything below the 200 ms mark is considered good. Under 100 ms, the TTFB is considered excellent. As you can see from the following timing waterfall, the TTFB of this website can be as low as 30ms, which is an outstanding result. After all, Siteground is now hosting its servers from the Google Cloud datacenters.
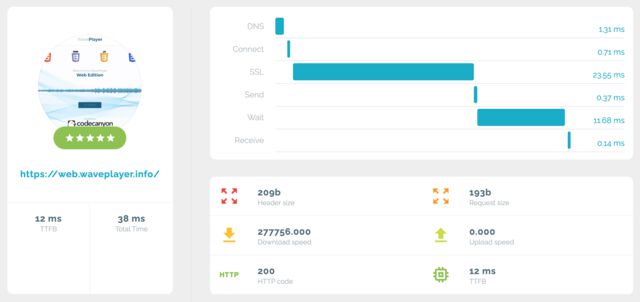
The timing waterfall leading to the TTFB as measured on Byte Check
Best vs. Average
Another notable difference in our tests is that we will always consider the best, not an average of all our attempts. The reason is simple: any fluctuations in the connection speed during our tests could negatively impact the results we get; those fluctuations, though, cannot be attributed to our script. For example, if our website is ever capable of a TTFB of 6 ms, that value will be our reference because any value longer than that, while negatively affecting a PageSpeed score, is not something our script is responsible for.
For the same reason, if we run a GTMetrix test ten times and we get a perfect 100% score, we will consider that our result even if we got that one only time in tens of tests. It is easy to understand that if our script is capable of getting a perfect 100% score once, the fact that we are not getting it every time cannot be attributed to the script itself but rather to the fluctuations in every other factor.
This observation is even stronger when we consider that all the other factors that are really measuring the performance of the internal website components could not get any better. This is the case of the Total Blocking Time (TBT) that, for all our tests, was stable at 0 ms, which proves that our script doesn’t introduce any blocking time to the loading of the page when loaded with the appropriate strategies.

A summary of the GTMetrix results for this page
A slim page
As we clarified earlier, our main goal is not optimizing this website but rather ensuring that our plugin does not have any negative impact on the loading times of these pages. Nevertheless, in order to make our case stronger, we decided to design a website that uses as few resources as possible. If we can get a stable 100% score for our page whether our plugin is installed or not, that would prove without any further doubt that we reached our final goal.
Fonts
No external webfonts are loaded by this website. The fonts you see are those installed in your system. This reduces the requests and the total page size, improving the FCP, the LCP and the Speed Index.
Images
All the images on this page are either SVG or served in both JPG and WEBP format and in multiple sizes (1920, 1280, 640, 320, 160, 80, 40). Furthermore, the markup of the images is defined as follows: The lazy loading prevents the browser from requesting any image below the fold. The multiple sizes in the srcset allows the browser to load the most appropriate size for the current visitor's device screen size.
Stylesheets
All the stylesheet are preloaded using the following technique: This ensures that no stylesheet is blocking the loading of the page.
Since deferring the main stylesheet responsible for the structure of the page
may cause large shifts on the page when it is finally loaded,
negatively impacting the Cumulative Layout Shift,
the CSS rulesets necessary to structure the page are
incorporated as an inline <style> element.
Scripts
All the scripts, including the one for WavePlayer, are loaded right before the closing body tag and are deferred.
Deferring the WavePlayer script is always possible because it is completely independent from any other library, including jQuery. So, the deferral of the script will never lead to any error or break any functionality.
Icons
Icons are a very popular resource for most of modern websites. Among all the sets available online, Font Awesome is by far the most popular one. But why should we load hundreds of icons if our website uses only a handful of them? The Free version of Font Awesome includes 1609 icons and loads resources for a total of 120 kB. All this just because you need a pin for your map, an hamburger for your menu and a few brand icons for your social links.
This website uses some icons from Font Awesome but loading them from a reduced stylesheet and webfont, customized to the exact needs of these pages. By doing this, we are able to incorporate the icons we need (about 40 in total) while reducing the size of the font and CSS files to less than 5 kB and before Gzip compression kicks in.
Thanks to all the strategies described in this section, we were able to elevate this website to a constant 100% score across all the online tools that use Google Lighthouse to test the performance of a website.